Page 2 - SMA-third-quarter
P. 2
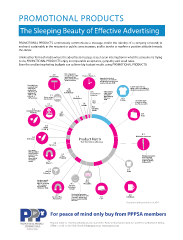
PROMOTIONAL PRODUCTS The Sleeping Beauty of Eective Advertising Product State of the Industry 2013 PROMOTIONAL PRODUCTS continuously communicate a message and/or the identity of a company or brand; to anchor it sustainably in the recipient or public consciousness, and to invoke or conrm a positive attitude towards Number Crunch the donor. Product Matrix Unlike other forms of media where the advertisers message is seen as an interruption in what the consumer is trying to do, PROMOTIONAL PRODUCTS enjoy incomparable acceptance, sympathy and recall rates. Even the smallest marketing budgets can achieve big-budget results using PROMOTIONAL PRODUCTS! Apparel continues to lead the industry product categories, but other shifts are taking place. 2.0 This category has 1.0 remained very stable Housewares over the past five Clocks & Watches years, al ways close to Impacted by the tech 2% of the market. expansion, sales of clocks and watches have dropped significantly since 2008. Food gifts have increased their T-shirts represent $2.7 share of the 1.8 billion of the $19.4 billion in market from Books distributor revenues in 2012. .9% of overall 0.8 Safety impact: revenues in & Stationery Pocket/Purse Sales of toys 2009 to 2.2% 2.1 Products and games last year , a Automotive 1.8 have fallen by 144% increase. Electronics 65% since Accessories 2009. 13.8 0.6 T-Shirts The market share of bags has fallen 2.2 1.4 Toys by 21% since 2009. Food Gifts Textiles 0.6 2.2 Sporting Computer-Related Goods Products 2.1 Other 8.7 Shirts Bags 2.8 Health & Safe ty 8.1 3.0 Writing Instruments USB Drives Product Matrix 3.0 % of Total Industr y Revenue Calendars As a group, USBs and other electronic/tech products now 3.5 represent Other Writing instruments about 10% of Products have increased from 6.4% of the the overall market in 2010 to market. 3.2 Magnets 8.1% in 2012. 3.7 1 6.7 Awards Polos & Jewelry Incentive awards 4.8 are rebounding Other with the economy 4.3 Wearables – this category Buttons has grown by 105% since 2009. & Badges/ Decals 4.2 The big election year in 6.0 2012 helped increase sales Desk & Office of buttons, badges and 5.6 Drinkware Accessories bumper stickers by 48% Caps over 2011. Reprinted with permission of ASI® For peace of mind only buy from PPPSA members Physical Address: 2nd Floor, Building 3, Fancourt Oce Park.Cnr Northumberland Ave and Felstead Rd, North Riding. Oce: +27 (0) 11 321 0200 Email: info@pppsa.co.za www.pppsa.co.za 01_Presidents_letter v2.indd 3 2014/06/26 8:32 AM